
January–September 2026: Nine-Month Luxury Resale Review
From January through September 2026, Miami’s million-dollar residential market showed distinct patterns for condominiums and single-family homes. This review focuses on completed sales of $1 million or more across selected Miami neighborhoods, providing a consistent view of how luxury transactions and sale prices evolved throughout the first nine months of the year.
Monthly condominium and single-family closings
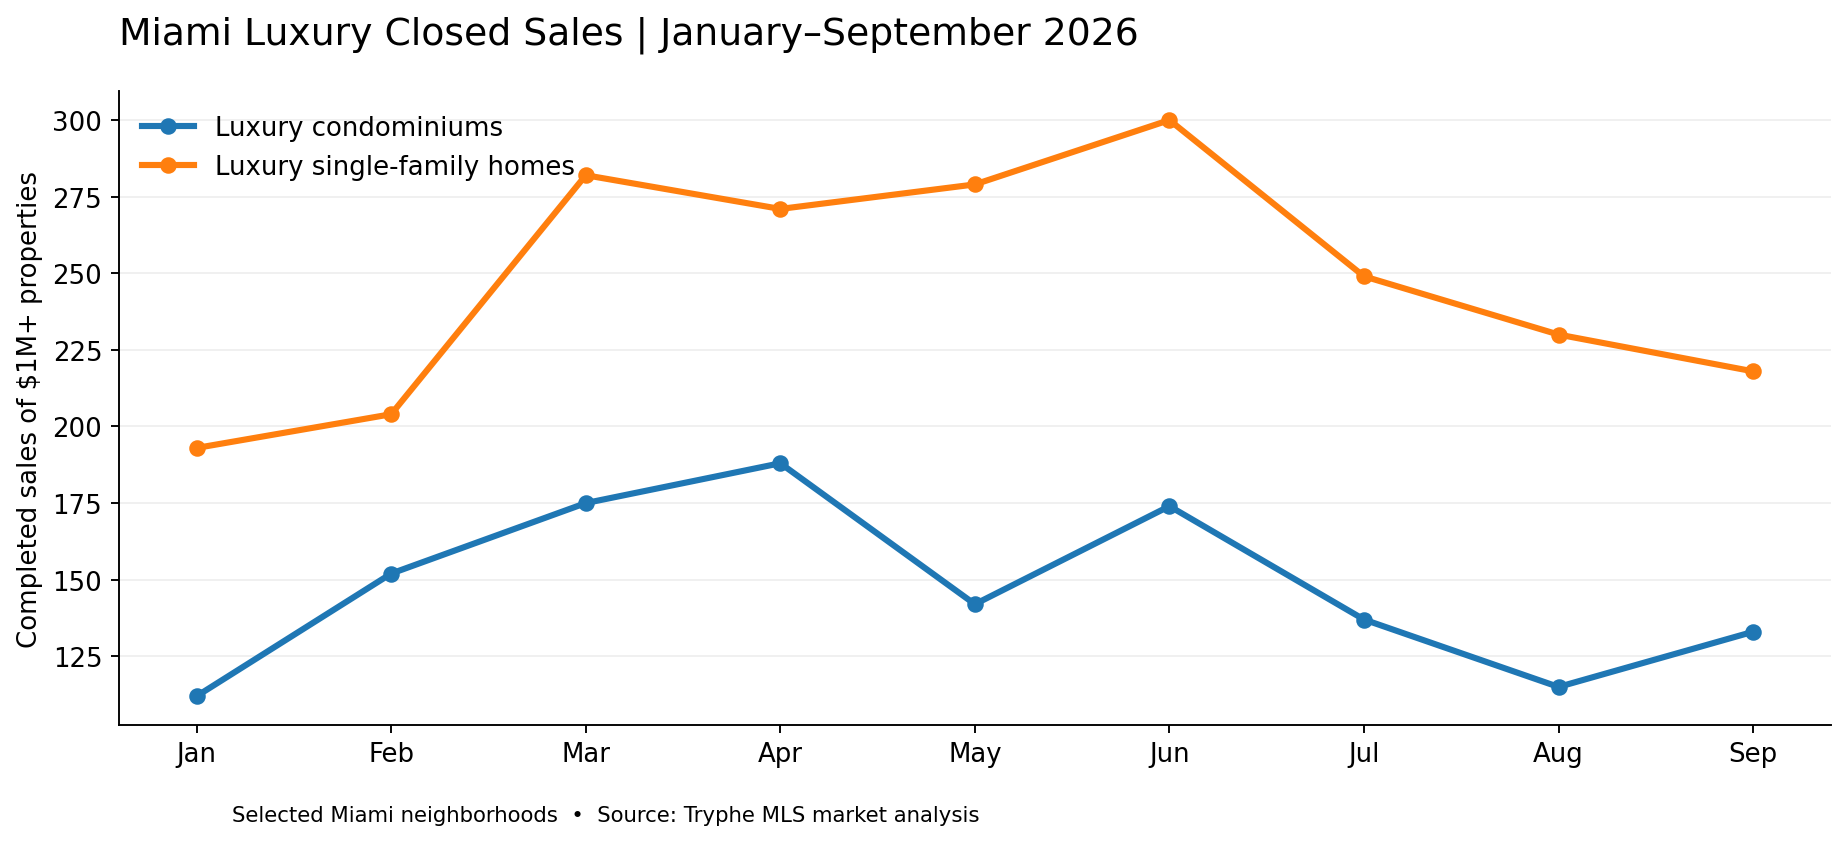
January 2026: 112 qualifying condominium closings (median $1.742M, mean $3.303M, median $1,009 per recorded living square foot); 193 qualifying single-family closings (median $1.900M, mean $3.540M, median $800 per recorded living square foot).
February 2026: 152 qualifying condominium closings (median $1.770M, mean $2.780M, median $954 per recorded living square foot); 204 qualifying single-family closings (median $1.675M, mean $2.853M, median $735 per recorded living square foot).
March 2026: 175 qualifying condominium closings (median $1.875M, mean $3.061M, median $983 per recorded living square foot); 282 qualifying single-family closings (median $1.688M, mean $4.131M, median $709 per recorded living square foot).
April 2026: 188 qualifying condominium closings (median $1.752M, mean $2.966M, median $988 per recorded living square foot); 271 qualifying single-family closings (median $2.050M, mean $3.450M, median $792 per recorded living square foot).
May 2026: 142 qualifying condominium closings (median $1.905M, mean $3.193M, median $1,088 per recorded living square foot); 279 qualifying single-family closings (median $1.780M, mean $3.570M, median $772 per recorded living square foot).
June 2026: 174 qualifying condominium closings (median $1.883M, mean $3.281M, median $1,026 per recorded living square foot); 300 qualifying single-family closings (median $1.726M, mean $3.391M, median $747 per recorded living square foot).
July 2026: 137 qualifying condominium closings (median $1.600M, mean $2.528M, median $975 per recorded living square foot); 249 qualifying single-family closings (median $1.913M, mean $3.612M, median $779 per recorded living square foot).
August 2026: 115 qualifying condominium closings (median $1.700M, mean $2.850M, median $996 per recorded living square foot); 230 qualifying single-family closings (median $1.890M, mean $2.926M, median $726 per recorded living square foot).
September 2026: 133 qualifying condominium closings (median $1.875M, mean $3.064M, median $1,082 per recorded living square foot); 218 qualifying single-family closings (median $1.683M, mean $3.428M, median $736 per recorded living square foot).
What the full nine months show
The nine-month condominium count peaked in April at 188 closings and reached its lowest level in January at 112. September’s 133 closings represent a rebound from August’s 115, but remain below the spring peak. The condominium median closing price ranged from $1.6 million in July to $1.905 million in May. The median condominium closing price per square foot reached $1,088 in May and $1,082 in September; these are monthly transaction-mix measures, not matched-property appreciation rates.
Single-family closings reached a nine-month high of 300 in June and declined to 249 in July, 230 in August and 218 in September. The monthly median single-family closing price was highest in April at $2.05 million and lowest in February at $1.6745 million. The single-family median price per recorded living square foot ranged from $709 in March to $800 in January. Month-to-month variation may reflect different locations, home sizes, waterfront exposure and property quality among the closings.
From January through September, 1,328 condominiums and 2,226 single-family homes sold for at least $1 million across the areas covered in this review—a combined 3,554 completed transactions. September totals may be revised as additional sales are reported.
Why nine-month context changes the September interpretation
The September condominium rebound is real within the queried records, but it follows a period of stronger spring activity. September’s condo count was approximately 29.3% below April’s peak, despite being 15.7% above August. September single-family closings were approximately 27.3% below June’s peak. Neither percentage should be confused with a year-over-year change: the comparison uses only 2026 months, and seasonal patterns cannot be established from one partial calendar year.
For pricing decisions, compare properties in the same building or closely matched neighborhood and distinguish waterfront from non-waterfront homes. Miami-Dade’s rising months of supply signals greater overall buyer choice, but conditions vary substantially across individual communities.
Methodology and limitations
About this market review: The figures cover completed sales from January 1 through September 30, 2026, priced at $1 million or more, in selected Miami-area neighborhoods. They include condominiums and single-family homes, but not every community in Miami-Dade County. Median prices and price per square foot reflect homes sold in each month, so changes may also reflect differences in size, location, condition and waterfront access. September figures are subject to later revisions.
Miami-Dade Luxury Inventory: January–September 2026
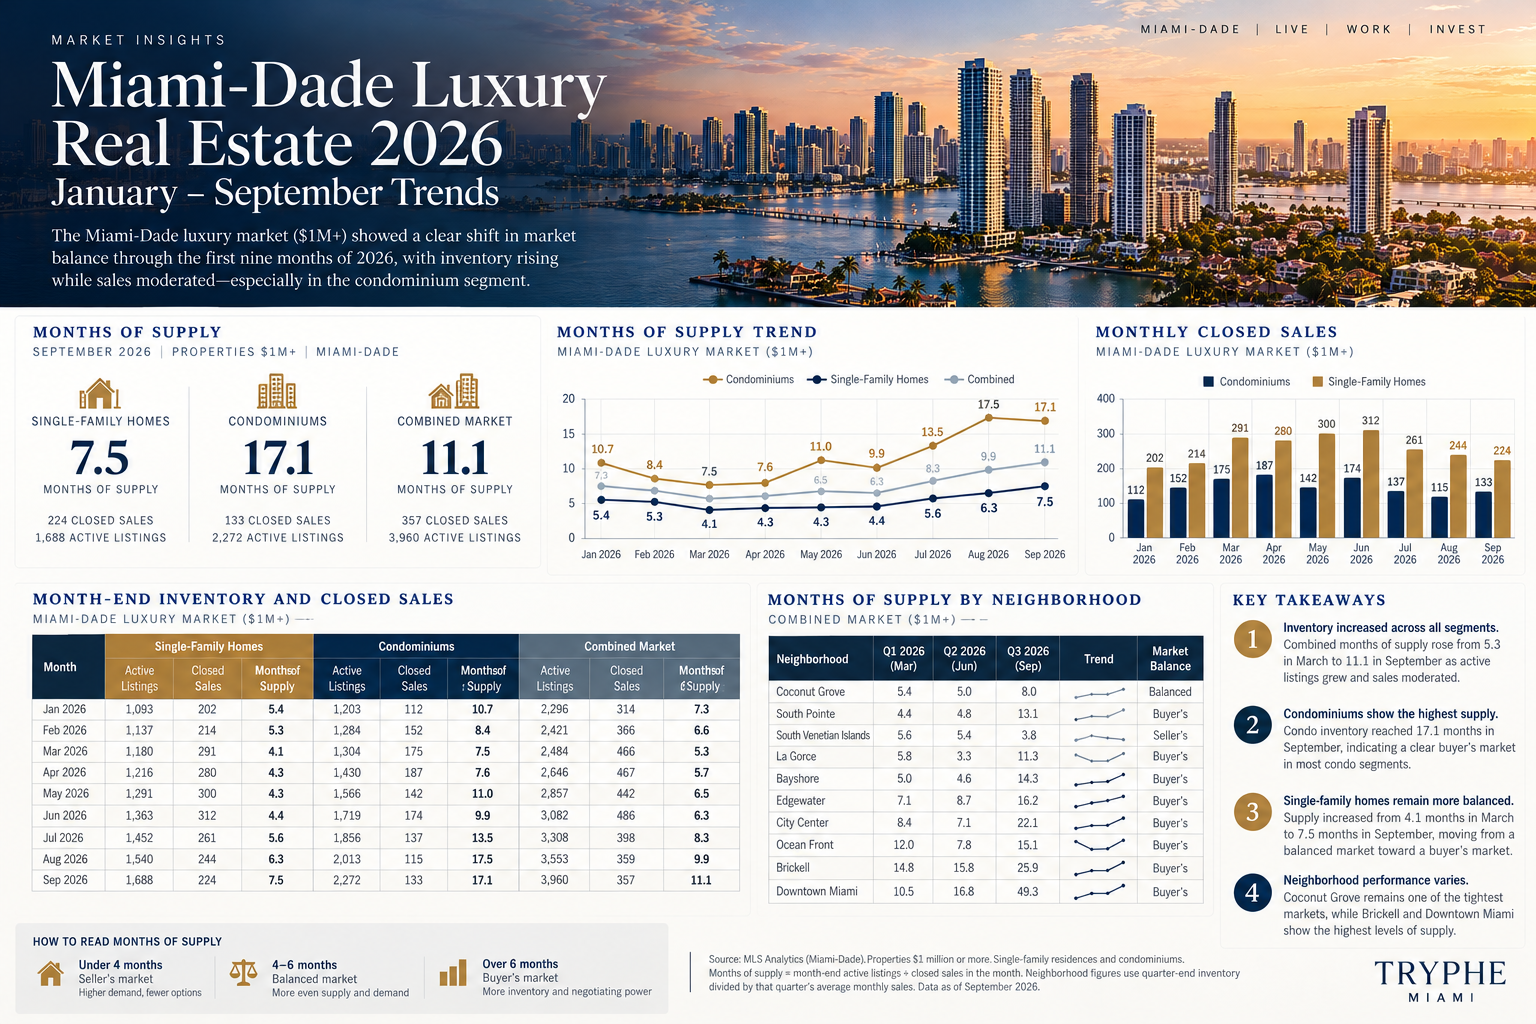
Miami-Dade’s luxury market shifted markedly over the first nine months of 2026. By September, 3,960 condominiums and single-family homes priced at $1 million or more were available at month-end, compared with 2,296 in January. The market had 11.1 months of supply in September, up from 7.3 in January and 5.3 in March. These historical month-end figures offer a clearer view of market direction than a single current inventory snapshot.
September’s 3,960 active luxury listings comprised 2,272 condominiums and 1,688 single-family homes. Condominiums represented approximately 57% of the combined inventory. The supply of available homes increased across both categories as sales activity moderated, giving buyers more choice in many neighborhoods.
Months of Supply: January to September
January: single-family 5.4 months, condominiums 10.7, combined 7.3. March: single-family 4.1, condominiums 7.5, combined 5.3. June: single-family 4.4, condominiums 9.9, combined 6.3. September: single-family 7.5, condominiums 17.1, combined 11.1. The condominium market remained buyer-favorable throughout the period; single-family homes shifted from balanced conditions to buyer-favorable supply.
Months of supply compares homes available at the end of each month with the number of homes sold during that month. As a general guide, fewer than four months indicates a seller’s market, four to six months a balanced market, and more than six months a buyer’s market. Monthly figures can fluctuate, especially in small neighborhoods; quarterly sales averages provide additional context.
Monthly Inventory and Market Balance
January 2026 — Single-family: 1,093 active / 202 sold / 5.4 months. Condominiums: 1,203 active / 112 sold / 10.7 months. Combined: 2,296 active / 314 sold / 7.3 months.
February 2026 — Single-family: 1,137 active / 214 sold / 5.3 months. Condominiums: 1,284 active / 152 sold / 8.4 months. Combined: 2,421 active / 366 sold / 6.6 months.
March 2026 — Single-family: 1,180 active / 291 sold / 4.1 months. Condominiums: 1,304 active / 175 sold / 7.5 months. Combined: 2,484 active / 466 sold / 5.3 months.
April 2026 — Single-family: 1,216 active / 280 sold / 4.3 months. Condominiums: 1,430 active / 187 sold / 7.6 months. Combined: 2,646 active / 467 sold / 5.7 months.
May 2026 — Single-family: 1,291 active / 300 sold / 4.3 months. Condominiums: 1,566 active / 142 sold / 11.0 months. Combined: 2,857 active / 442 sold / 6.5 months.
June 2026 — Single-family: 1,363 active / 312 sold / 4.4 months. Condominiums: 1,719 active / 174 sold / 9.9 months. Combined: 3,082 active / 486 sold / 6.3 months.
July 2026 — Single-family: 1,452 active / 261 sold / 5.6 months. Condominiums: 1,856 active / 137 sold / 13.5 months. Combined: 3,308 active / 398 sold / 8.3 months.
August 2026 — Single-family: 1,540 active / 244 sold / 6.3 months. Condominiums: 2,013 active / 115 sold / 17.5 months. Combined: 3,553 active / 359 sold / 9.9 months.
September 2026 — Single-family: 1,688 active / 224 sold / 7.5 months. Condominiums: 2,272 active / 133 sold / 17.1 months. Combined: 3,960 active / 357 sold / 11.1 months.
How Supply Differs by Neighborhood
At the end of the third quarter, Coconut Grove had approximately 8.0 months of luxury supply, compared with 13.1 in South Pointe, 16.2 in Edgewater, 25.9 in Brickell and 49.3 in Downtown Miami. South Venetian Islands was tighter at 3.8 months. Neighborhood figures compare quarter-end listings with average monthly closings during that quarter, so they should not be directly compared with the single-month countywide readings. Smaller markets can change rapidly with just a handful of transactions.
Condominiums: 17.1 Months of Supply in September
Luxury condominium supply rose from 10.7 months in January to 17.1 months in September, reaching 17.5 months in August. September ended with 2,272 active condominium listings and 133 completed sales of $1 million or more. Under a commonly used market benchmark, more than six months of supply favors buyers. Competition and pricing power still differ significantly between buildings, waterfront locations and exceptional residences.
Single-Family Homes: 7.5 Months of Supply in September
Single-family luxury inventory rose from 1,093 active homes in January to 1,688 in September. Months of supply moved from 5.4 in January to 4.1 in March, before rising to 7.5 in September. This marks a transition from broadly balanced conditions in the spring to a buyer-favorable market by late summer. Scarce waterfront properties, dockage and larger lots can still command a premium.
Combined Luxury Market: 11.1 Months of Supply
Across both property categories, Miami-Dade’s $1 million-plus inventory increased from 2,296 active listings in January to 3,960 in September. Combined months of supply rose from 7.3 to 11.1, with the most balanced reading in March at 5.3 months. The September figure reflects 3,960 month-end listings and 357 completed sales, compared with 314 sales in January. These numbers show the growing gap between available homes and the pace of closings.
What Rising Months of Supply Means for Buyers and Sellers
Buyers have more alternatives in the overall luxury market, particularly in condominiums. Still, the relevant comparison is among similar residences in the same neighborhood or building. A prime waterfront estate, boutique building or exceptional penthouse may not behave like the broader market.
For sellers, rising supply reinforces the importance of realistic pricing, strong presentation and recent comparable sales. In neighborhoods with more than a year of supply, buyers may have greater negotiating leverage; in tighter micro-markets, distinctive properties can still attract competitive interest. Monthly inventory trends should be assessed alongside property quality, location and buyer demand.
The monthly supply figures reflect month-end active listings divided by completed sales during the same month, for Miami-Dade condominiums and single-family homes priced at $1 million or more. Historical inventory estimates may be revised because past listing-status changes and asking-price histories are not always fully captured. This countywide inventory series is not directly interchangeable with the selected-neighborhood sales analysis elsewhere in this article.
Miami’s $1 million-plus residential market delivered a split signal in September 2026: condominium sales rose from August while single-family sales declined. Across the selected Miami neighborhoods in this review, 133 luxury condominiums sold in September, compared with 115 in August. Single-family homes recorded 218 sales, down from 230. These figures represent completed transactions—not properties currently for sale or under contract.
The median closing price for the qualifying condominium transactions reached $1.875 million in September, compared with $1.7 million in August. For single-family homes, the median moved from $1.89 million to $1.6825 million. Those shifts describe the mix of homes sold during each month; they do not prove that the market value of an otherwise identical home rose or fell by the same percentage.
What Changed in Miami’s Million-Dollar Condo Sales?
Luxury condominium sales reached 137 in July, fell to 115 in August and recovered to 133 in September. That represents a 15.7% monthly increase in September, although activity remained 2.9% below July. The median sale price rose from $1.6 million in July to $1.7 million in August and $1.875 million in September.
The average closing price also increased across the three months: approximately $2.53 million in July, $2.85 million in August and $3.06 million in September. Averages in the upper end of the market can be moved substantially by a small number of expensive sales, so the median provides a useful complementary measure. Neither metric is a repeat-sales index, and neither adjusts for differences in building, condition, floor level, water exposure or residence size.
Did Luxury Single-Family Home Sales Follow the Same Pattern?
No. Completed sales of single-family homes priced at $1 million or more declined from 249 in July to 230 in August and 218 in September. September activity was 5.2% below August and 12.4% below July. The median sale price was $1.9125 million in July, $1.89 million in August and $1.6825 million in September.
The September average single-family closing price was approximately $3.43 million, higher than August’s $2.93 million even as the median declined. This is an important distinction. It suggests that a smaller set of high-priced transactions may have influenced the average while the typical transaction within the million-dollar-and-up sample occurred at a lower price point. Without inspecting the individual closings and property attributes, the difference should not be interpreted as a broad rise in waterfront estate valuations.
What Does Price per Square Foot Reveal?
For qualifying condominium closings with usable living-area data, the median recorded sale price per interior square foot was approximately $975 in July, $996 in August and $1,082 in September. That September measure is about 8.6% above August’s level. The calculation divides each property’s closing price by its recorded living area, then takes the median across transactions with usable area data.
For million-dollar single-family closings, the corresponding median was approximately $779 per square foot in July, $726 in August and $736 in September. September was approximately 1.4% above August but remained below July. These figures should not be used as direct price quotes for a particular residence. In luxury real estate, lot size, waterfront frontage, renovation quality, private docks, views and amenities can produce substantial differences that an area-based ratio does not capture.
How Should Buyers Interpret the September Condo Rebound?
The combination of more million-dollar condominium closings and a higher median price is evidence that September’s completed transaction mix differed from August’s. It is not, on its own, evidence of a shortage of available condos or a marketwide acceleration in appreciation. Transaction counts describe deals that reached closing; inventory, absorption, contract velocity and listing concessions require additional measures.
A buyer comparing branded residences, penthouses or established luxury buildings in Brickell, Coconut Grove, Miami Beach or other Miami neighborhoods should use the same-building and closely comparable closed sales wherever possible. A county-area median can provide context, but a waterfront penthouse and an inland condominium are not interchangeable assets. Project launch announcements should also remain separate from resale closing statistics because reservations and deposits are not completed sales.
What Does the Data Mean for Luxury Home Sellers?
For single-family sellers, September’s lower count and median among million-dollar closings argue for careful comparable-sale selection rather than automatic price increases. The increase in average price relative to August illustrates why a few exceptional estates can distort a broad benchmark. A seller of a canal-front house should examine recent nearby waterfront closings, lot frontage, bridge clearance, renovation level and days on market rather than rely on an overall luxury average.
For condominium sellers, the September rebound is a useful conversation starter, but it does not establish that every building gained pricing power. Compare active competition, recent accepted contracts where reliably available, and verified closings in the same product class. Asking prices are marketing decisions; closing prices are transaction outcomes. Both are relevant, but they answer different questions.
The Market Behind the Numbers
This review examines completed condominium and single-family home sales of $1 million or more across selected Miami-area neighborhoods from January through September 2026. It offers a focused picture of the luxury resale market, rather than a complete accounting of every property sale in Miami-Dade County.
The geographic coverage includes selected Miami neighborhoods rather than all of Miami-Dade County. The $1 million threshold provides a consistent way to examine higher-priced homes, although luxury means different things in different neighborhoods. Some September transactions may be reflected in later market updates.
The data also does not isolate branded residences, waterfront parcels, penthouses or new construction. Such segments may behave differently from the overall million-dollar sample. Changes in median closing price and price per square foot can reflect which properties sold rather than an appreciation or depreciation of comparable homes. No causal explanation about interest rates, international demand or developer incentives is implied by these records alone.
What Should Investors and Buyers Watch Next?
The next useful test is whether October’s luxury inventory continues to grow relative to closings. In September, Miami-Dade had 17.1 months of condominium supply, 7.5 months of single-family supply and 11.1 months combined. These figures suggest increased choice for buyers, while property-level comparisons remain essential.
For branded and preconstruction residences, buyers should monitor verified permitting, construction progress, official price releases and condominium offering documents separately from MLS resale activity. A newly announced project expands the future pipeline; it does not automatically increase today’s completed inventory. This distinction is especially relevant in Miami’s high-profile branded-residence segment, where marketing timelines and actual delivery milestones can be years apart.
Frequently Asked Questions
How many Miami-area condos above $1 million closed in September 2026?
In September 2026, 133 condominiums sold for $1 million or more across the selected Miami neighborhoods, up from 115 in August.
What was the median luxury condo closing price in September?
The median for qualifying $1 million-plus condominium closings was $1.875 million. This is a median for completed transactions within the selected geography and threshold, not the median asking price of active luxury listings.
Did million-dollar single-family home sales increase?
No. September recorded 218 completed sales of single-family homes priced at $1 million or more, compared with 230 in August. The median sale price was approximately $1.683 million.
Are these numbers the complete Miami-Dade luxury market?
No. The report focuses on selected Miami neighborhoods and completed condominium and single-family home sales priced at $1 million or more. It is a focused view of the higher-end resale market, not a complete countywide total.
Do rising condo medians prove that prices are appreciating?
Not necessarily. A higher median may reflect a greater share of larger, better-located or more expensive residences closing in a particular month. Repeat-sales or matched-comparable analysis is needed to make stronger claims about price appreciation.
The Bottom Line
September 2026 delivered a differentiated picture for Miami-area million-dollar resales: condominium closing volume recovered from August while single-family volume continued to ease. Condo medians moved higher; the single-family median moved lower. These are valuable signals for choosing comparable properties and identifying where deeper analysis is warranted, but they are not substitutes for neighborhood-level underwriting, current inventory checks or verified property-by-property sales evidence.